
2024-11-11
In this section, you will learn how to draw basic shapes using p5.js. First, let's explain how to create a canvas for drawing.
Creating a Canvas
In p5.js, you create a canvas for drawing using the createCanvas function. Let's try writing code in sketch.js to create a canvas with a width of 400 pixels and a height of 400 pixels.
function setup() {
    createCanvas(400, 400);
    background('#D6E3ED');
}
When you run this code, a 400x400 pixel canvas will be displayed in your browser.

Using Drawing Functions
Now, let's draw shapes on the canvas we just created. p5.js provides convenient functions for drawing various shapes. Here are some basic drawing functions.
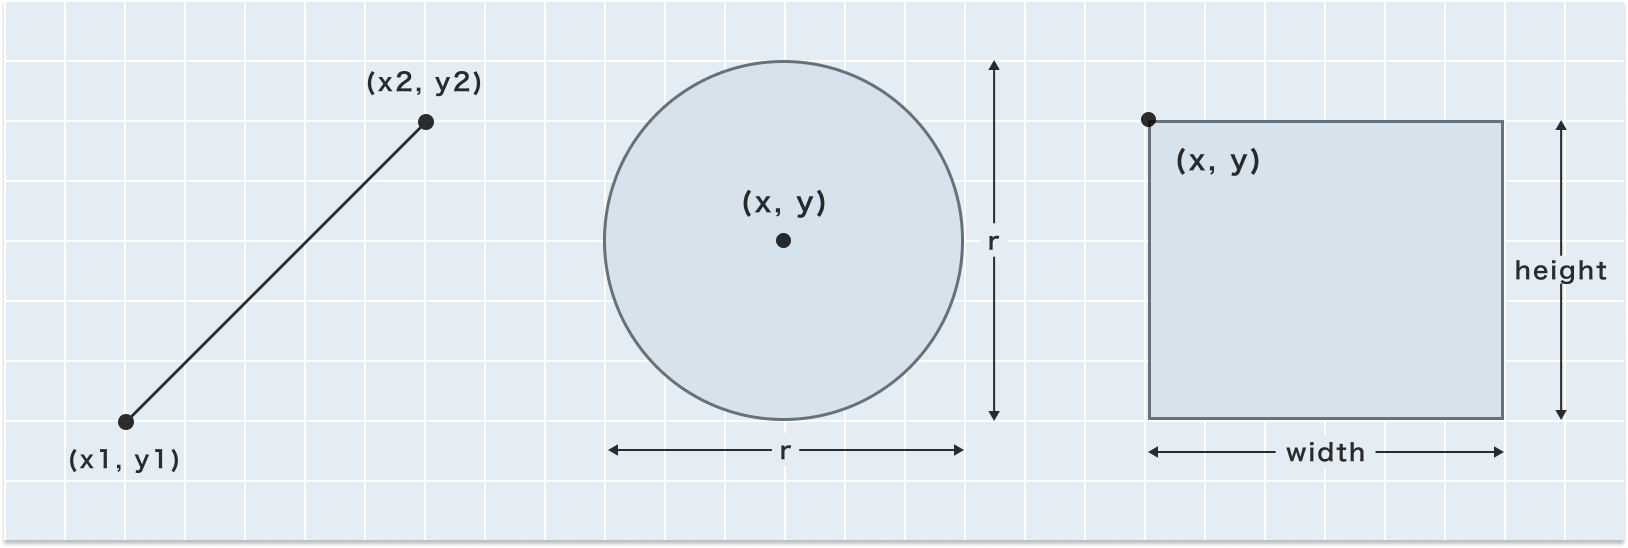
line(x1, y1, x2, y2): Draws a line.x1andy1are the coordinates of the starting point, andx2andy2are the coordinates of the endpoint.circle(x, y, r): Draws a circle.xandyare the coordinates of the center of the circle, andris the diameter.rect(x, y, w, h): Draws a rectangle.xandyare the coordinates of the top-left corner,wis the width, andhis the height.
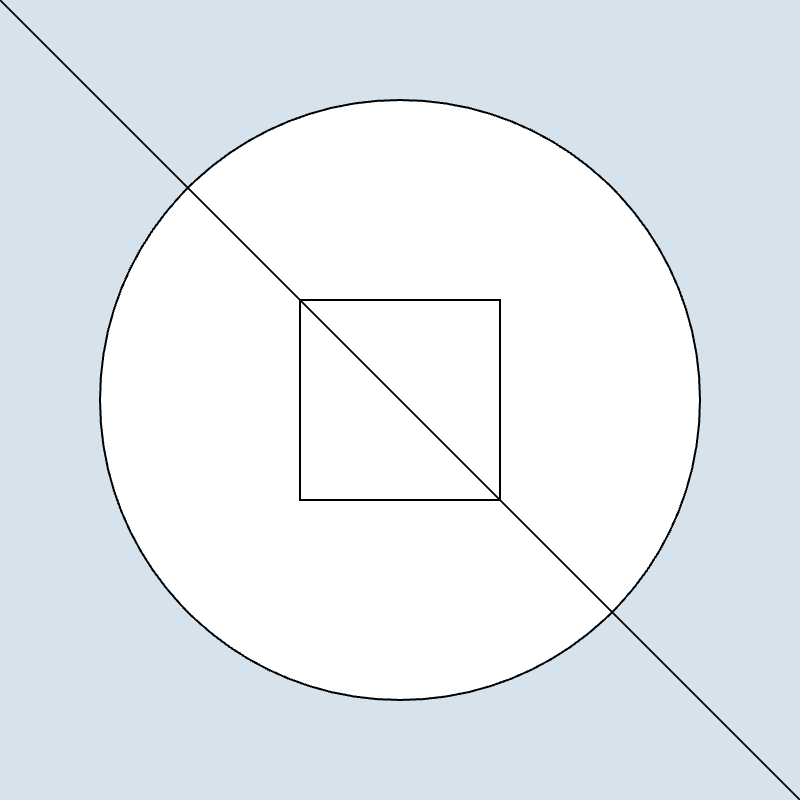
Below is an example of drawing basic shapes using these functions.
function setup() {
    createCanvas(400, 400);
    background('#D6E3ED');
    // Draw a circle
    circle(200, 200, 300);
    // Draw a rectangle
    rect(150, 150, 100, 100);
    // Draw a line
    line(0, 0, 400, 400);
}
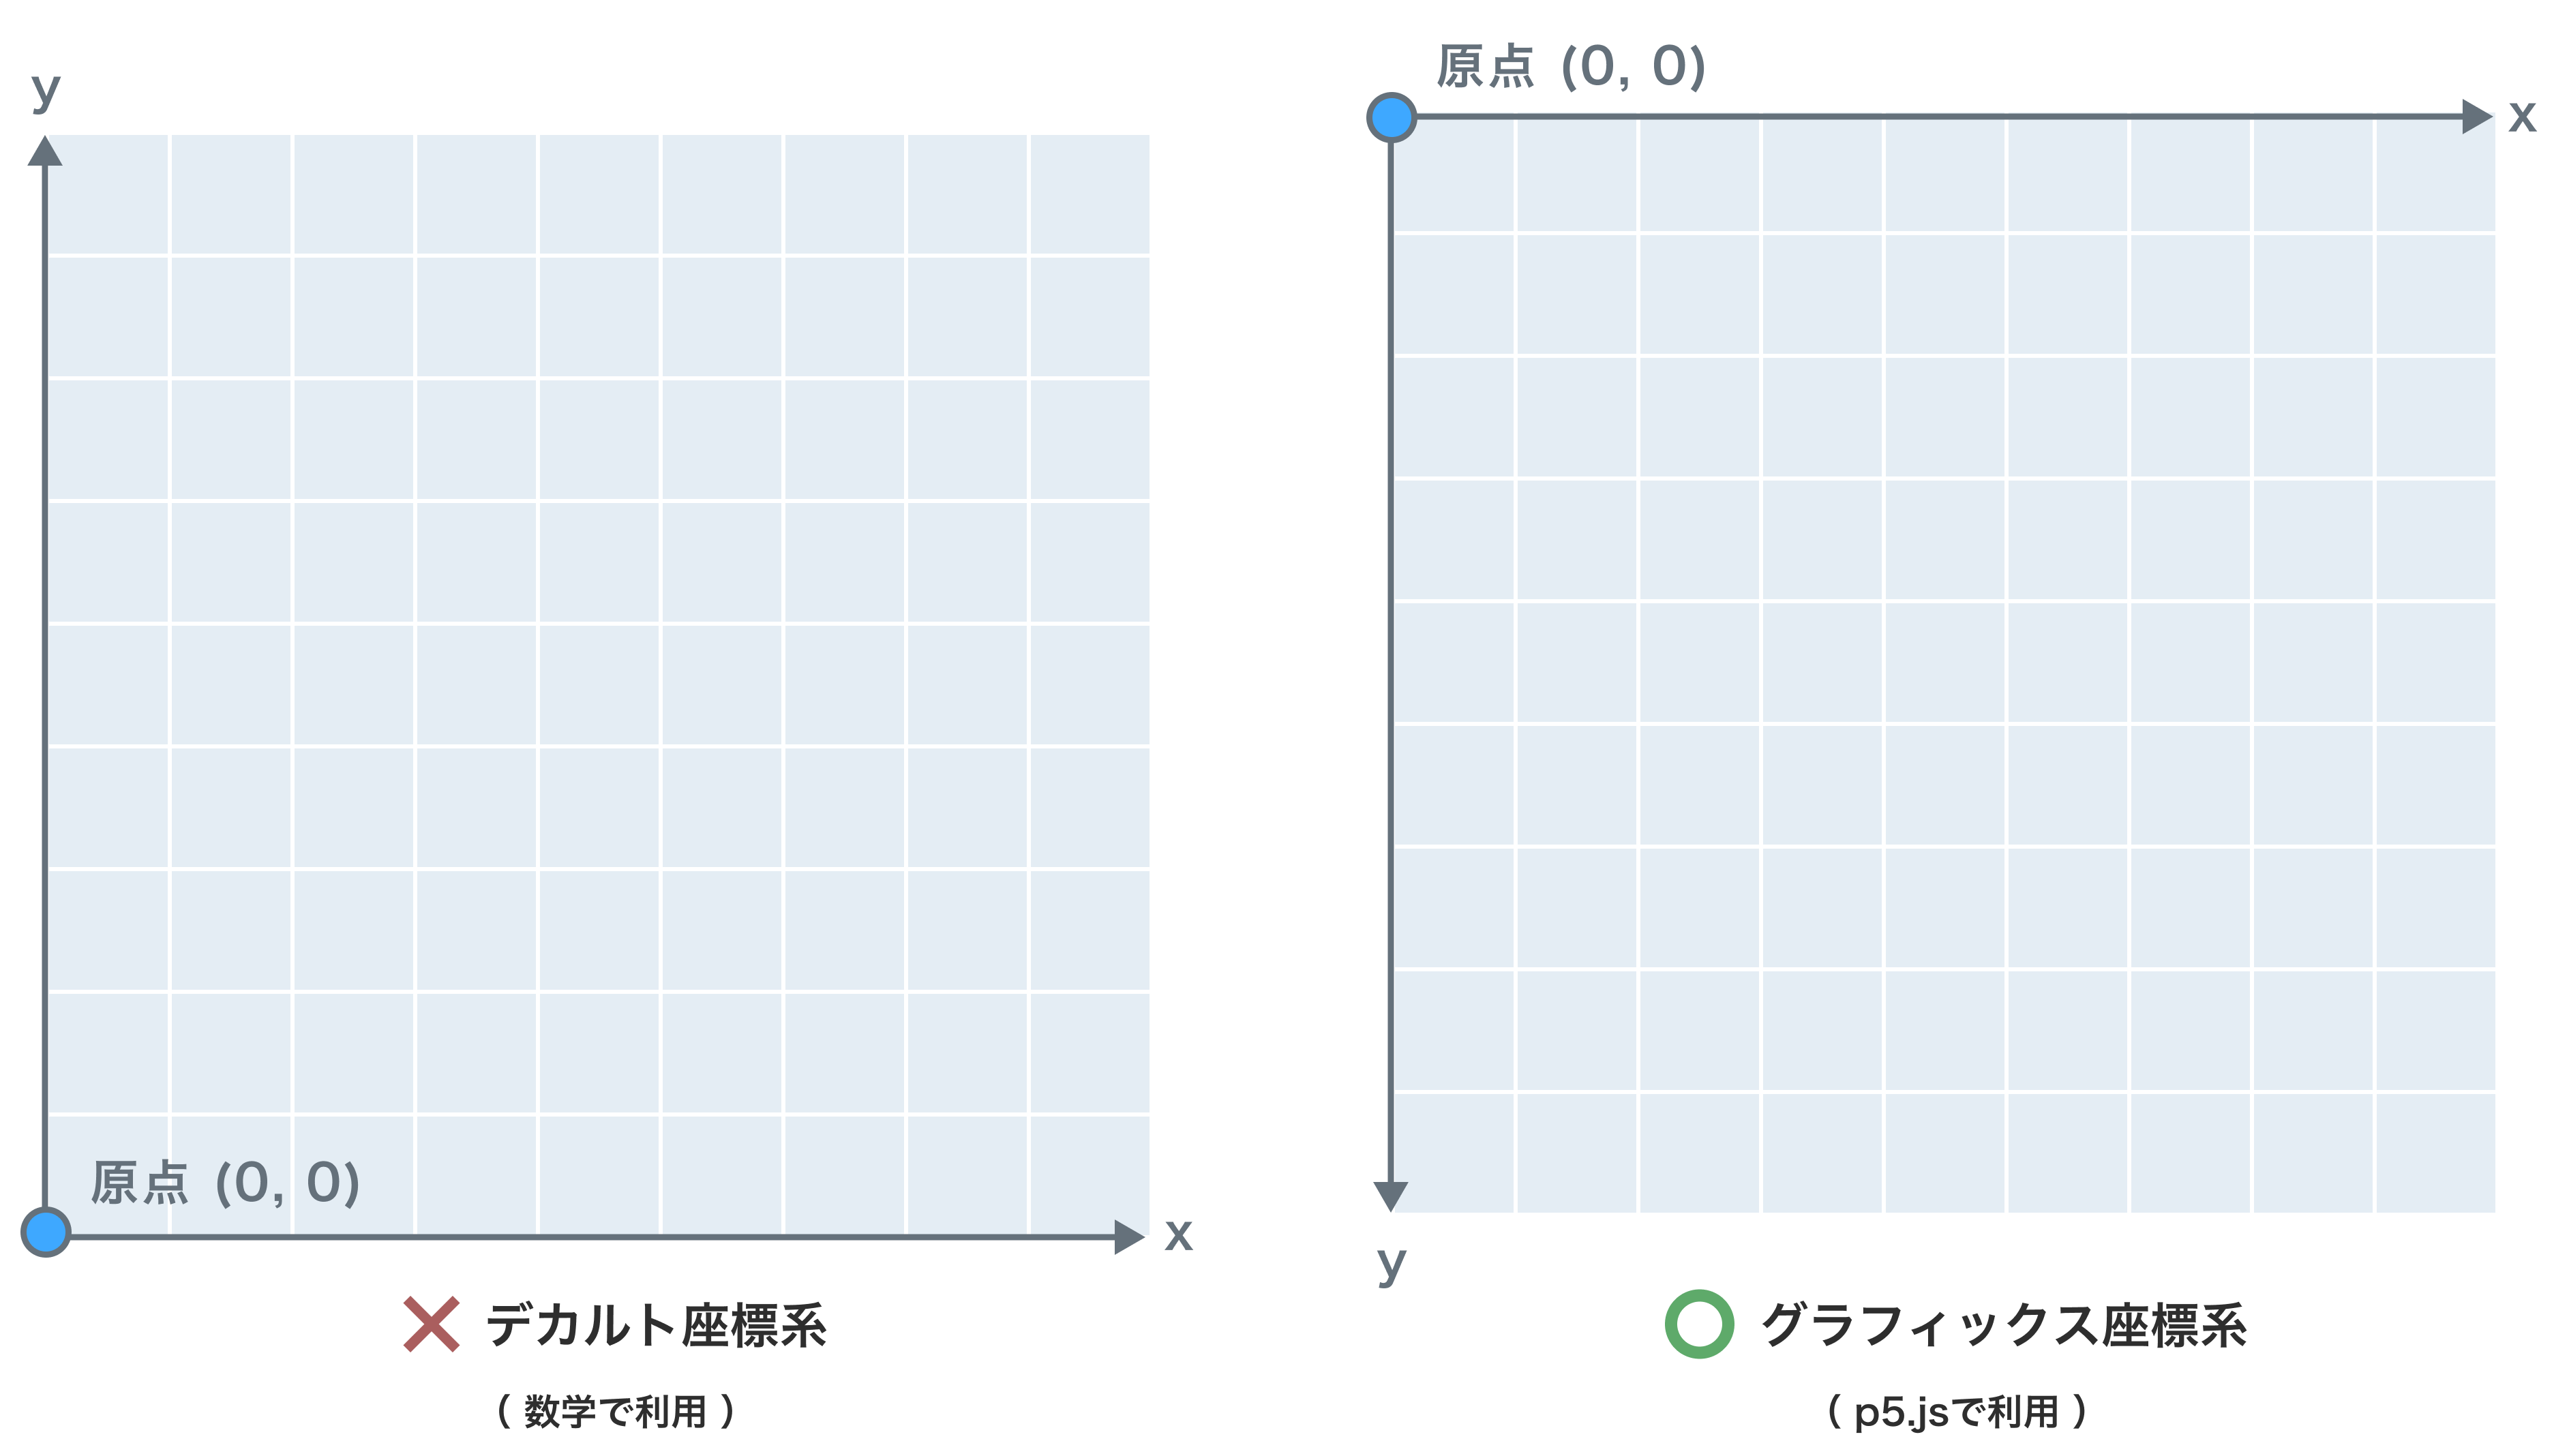
Understanding the Coordinate System
Did you notice anything unusual about the coordinate specifications of the drawing functions? In fact, the coordinate system in p5.js is different from the Cartesian coordinate system you learn in math class. In the usual coordinate system, the origin (0,0) is at the bottom left, but in the p5.js coordinate system (graphics coordinate system), the origin is at the top left. This means that the x-coordinate increases as you go to the right, and the y-coordinate increases as you go down. The following diagram shows the difference between the two coordinate systems.
List of p5.js Drawing Functions
In addition to rect(), circle(), and line(), p5.js provides various other drawing functions. Here are some of them.
| Function | Description |
|---|---|
ellipse(x, y, w, h) | Draws an ellipse. x and y specify the center coordinates, w is the width, and h is the height. |
rect(x, y, w, h) | Draws a rectangle. x and y specify the top-left corner coordinates, w is the width, and h is the height. |
rect(x, y, w, h, r) | Draws a rectangle with rounded corners. r specifies the radius of the rounded corners. |
rect(x, y, w, h, tl, tr, br, bl) | Draws a rectangle with different rounded corners. tl, tr, br, and bl specify the radius of the top-left, top-right, bottom-right, and bottom-left corners, respectively. |
line(x1, y1, x2, y2) | Draws a line. x1 and y1 specify the starting point coordinates, and x2 and y2 specify the endpoint coordinates. |
triangle(x1, y1, x2, y2, x3, y3) | Draws a triangle. Specifies the coordinates of the three vertices. |
quad(x1, y1, x2, y2, x3, y3, x4, y4) | Draws a quadrilateral. Specifies the coordinates of the four vertices. |
arc(x, y, w, h, start, stop) | Draws an arc. x and y specify the center coordinates, w is the width, h is the height, and start and stop specify the angles. |
point(x, y) | Draws a point. x and y specify the coordinates of the point. |
For more details, refer to the official p5.js reference. There are many other drawing functions available.
https://p5js.org/reference/#group-Shape